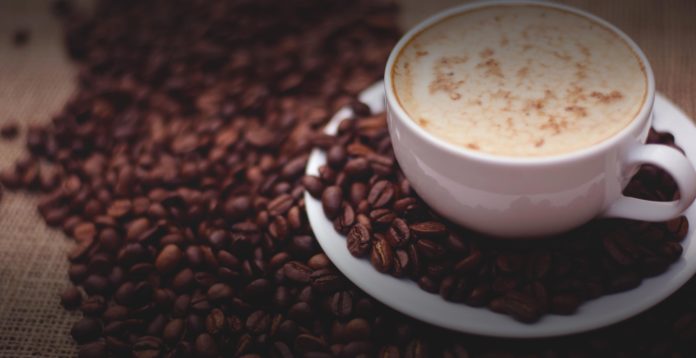
The choice of coffee and beer, depends on the psychoactive properties of these beverages and not their taste
Have you ever thought – why do you like dark roast coffee or hoppy beer while your colleague prefers sweet cola?
A new study showed taste preferences for bitter or sweet beverages aren’t based on variations in our taste genes, but rather genes related to the psychoactive properties of these beverages.
“The genetics underlying our preferences are related to the psychoactive components of these drinks,” said lead author, Marilyn Cornelis, assistant professor of preventive medicine at Northwestern University Feinberg School of Medicine. “People like the way coffee and alcohol make them feel. That’s why they drink it. It’s not the taste.”
The findings were published in the journal of Human Molecular Genetics.
Sugary beverages are linked to many disease and health conditions. Alcohol intake is related to more than 200 diseases and accounts for about 6 percent of deaths globally
The study highlights important mental reward components to beverage choice and adds to our understanding of the link between genetics and beverage consumption – and the potential barriers to intervening in people’s diets, Cornelis said.
Sugary beverages are linked to many disease and health conditions. Alcohol intake is related to more than 200 diseases and accounts for about 6 percent of deaths globally.
Researchers however, found one variant in a gene, called FTO, linked to sugar-sweetened drinks. People who had a variant in the FTO gene, the same variant previously related to lower risk of obesity – surprisingly preferred sugar-sweetened beverages.
“It’s counterintuitive,” Cornelis said. “FTO has been something of a mystery gene, and we don’t know exactly how it’s linked to obesity. It likely plays a role in behavior, which would be linked to weight management.”
Beverages were categorized into a bitter-tasting group and a sweet-tasting group. Bitter included coffee, tea, grapefruit juice, beer, red wine and liquor. Sweet included sugar-sweetened beverages, artificially sweetened beverages and non-grapefruit juices. This taste classification has been previously validated.
Beverage intake was collected using 24-hour dietary recalls or questionnaires. Scientists counted the number of servings of these bitter and sweet beverages consumed by about 336,000 individuals in the UK Biobank. Then they did a genome-wide association study of bitter beverage consumption and of sweet beverage consumption. Lastly, they looked to replicate their key findings in three U.S. groups.


